Ambrosia Care

Ambrosia Platform is integrating health apps and devices for patients and providers to see all information in one dashboard, and see relationships among data sources. They can see how glucose is changing with exercise, insulin, food. Patients can also decide which food is good or not so good for their diabetic health.

Providers can use Ambrosia Platform to see information from all the health apps and devices of their patients who invited/linked them to the Ambrosia Care platform data. Every patient’s notes entries are also available provided the patient entered these notes ( Food, Slow and Fast acting Insulin, Exercise, Medication, Comments) in the LinkBluCon app.

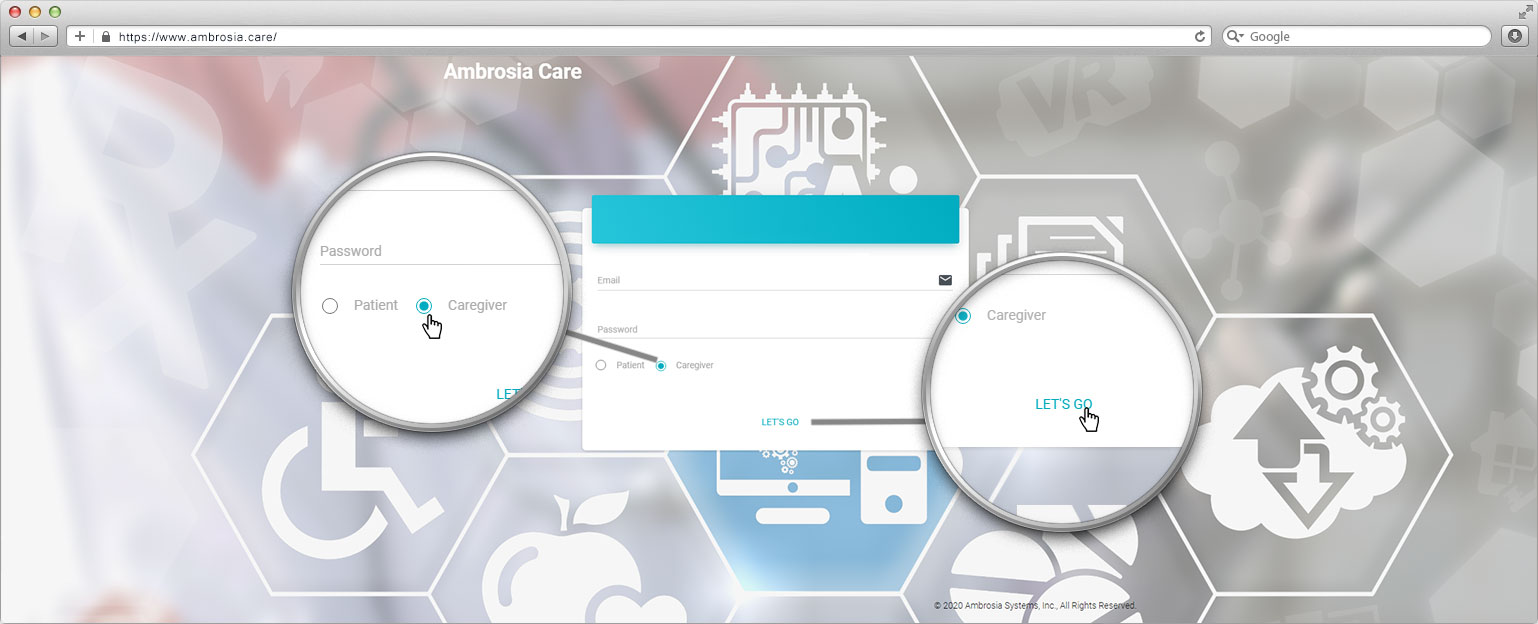
1 Ambrosia Care Login Screen
Providers/care givers use their FollowBluCon app login and password to login to platform after selecting “Caregiver” option.

Patients can also login to the Ambrosia.care platform to see information from all their own health apps and devices. They need to use their LinkBluCon app login and password and select “Patient” option in the login screen.

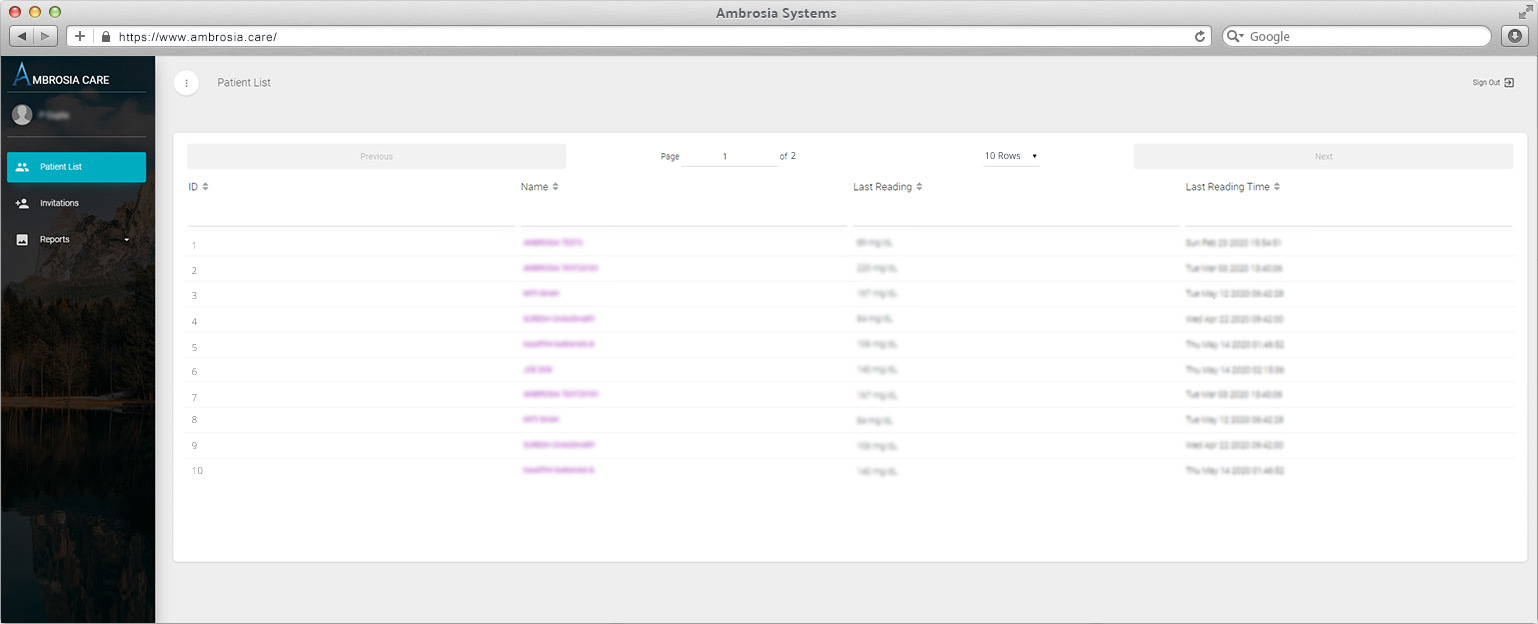
2 Patient List Screen
List of Patients with their last glucose reading and date time.
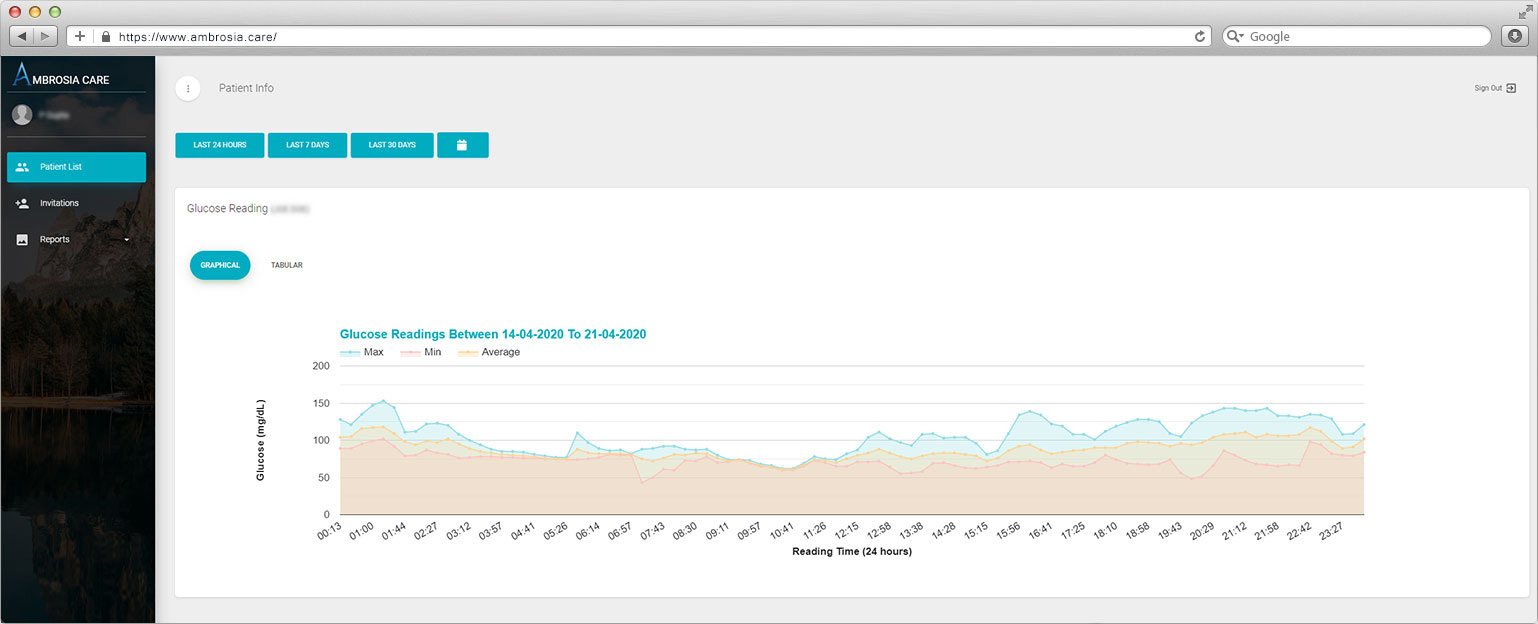
3 Patient Glucose Reading Graph
Glucose graph over a selected time period for the selected patient.
4 Notes Graph
Glucose graph over a selected time period is available with option to select food, exercise, insulin, medication etc for the selected patient.
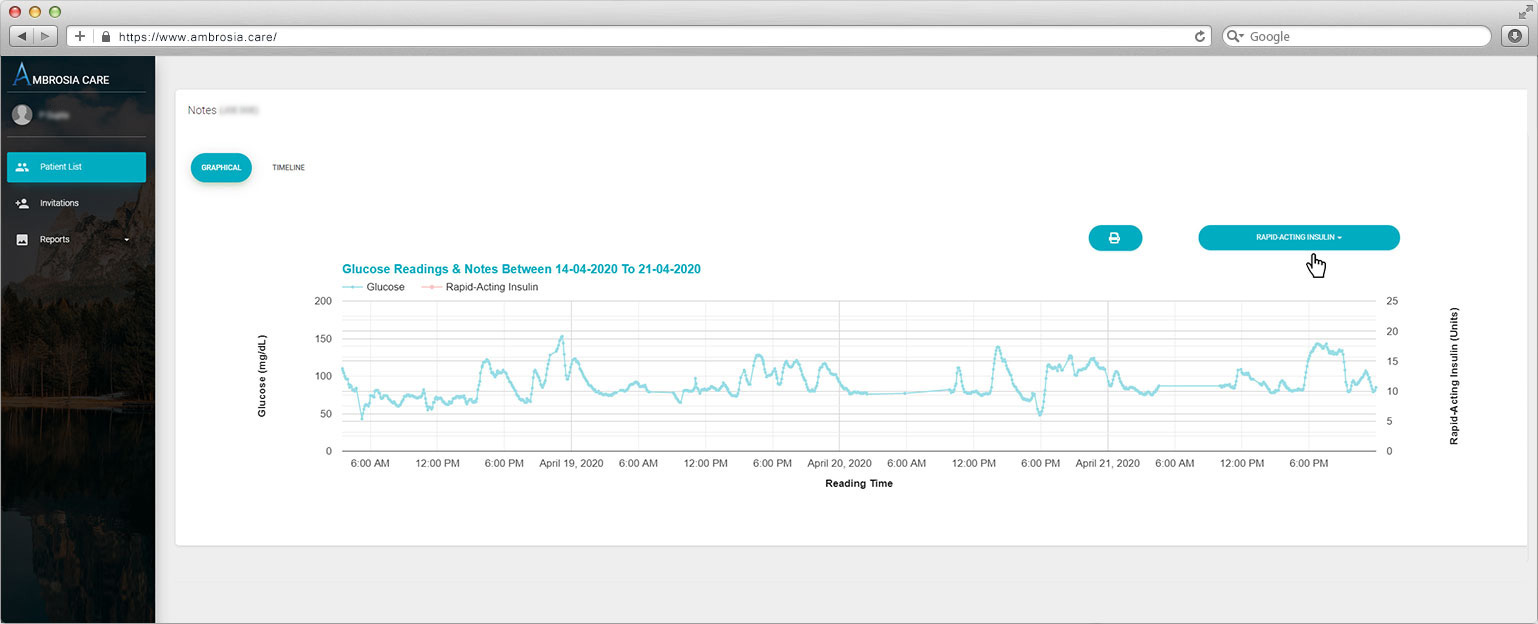
5 Glucose Reading vs. Rapid Acting Insulin Graph
Glucose graph over a selected time period for Rapid Acting Insulin selected from the drop down options for the selected patient.
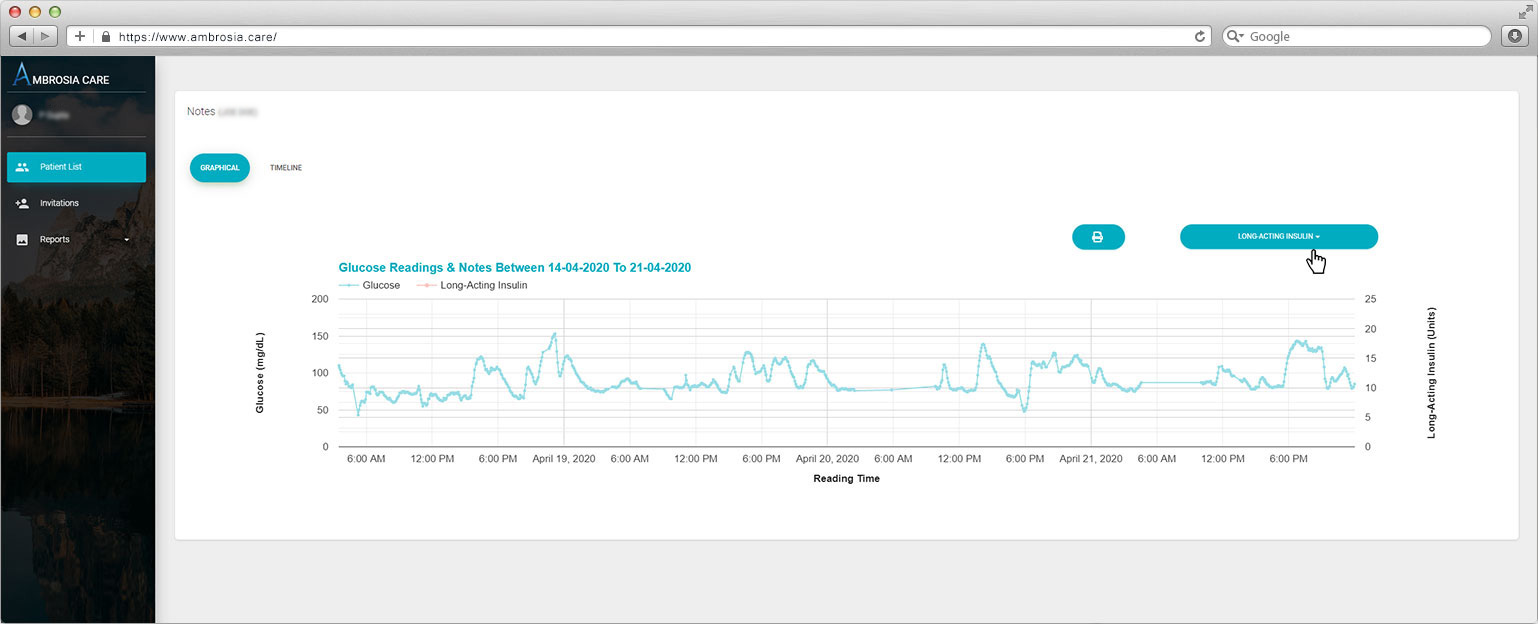
6 Glucose Reading vs. Long Acting Insulin Graph
Glucose graph over a selected time period for Long Acting Insulin selected from the drop down options for the selected patient.
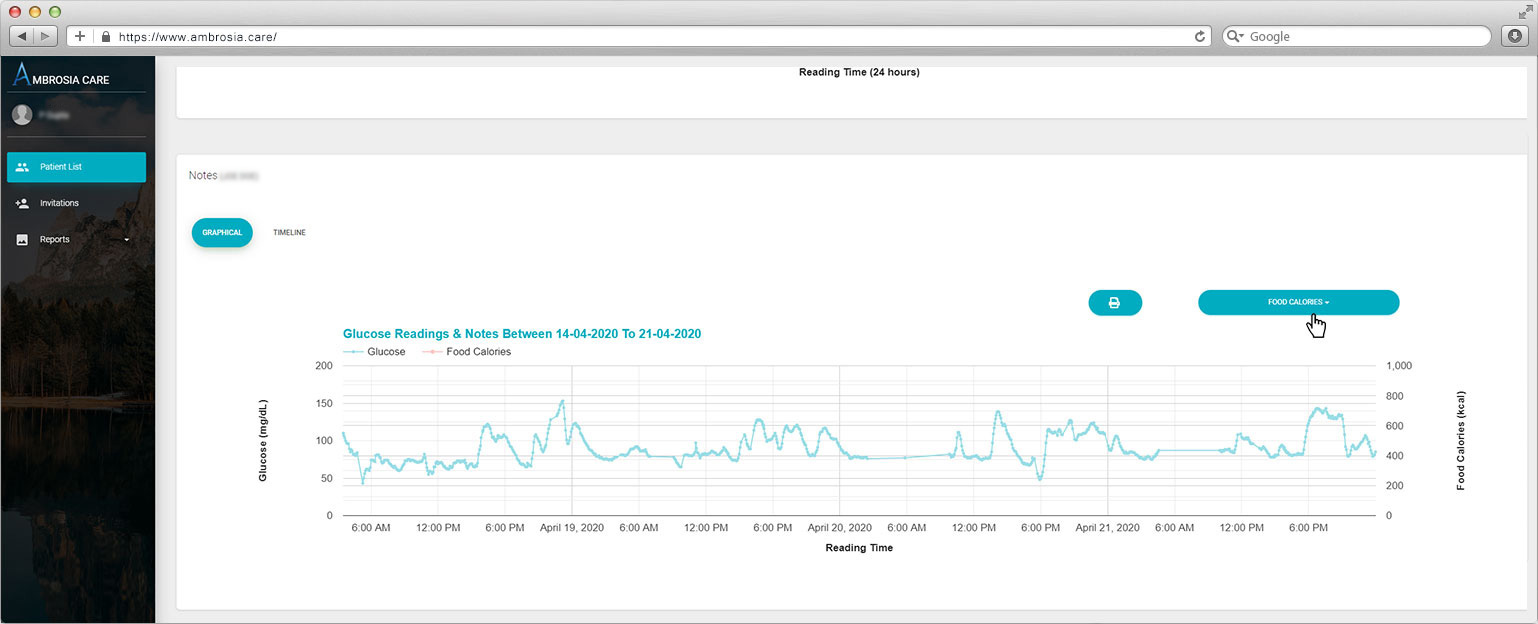
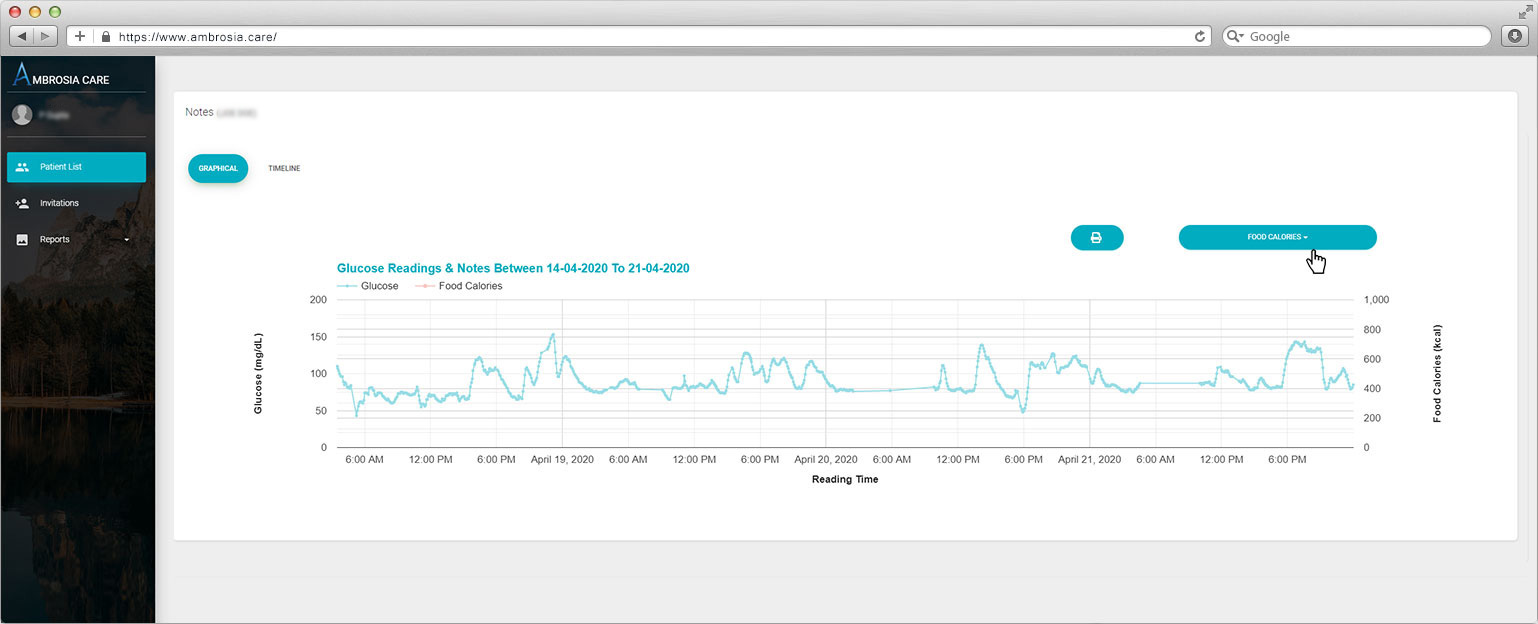
7 Glucose Reading vs. Food Calories Graph
Glucose graph over a selected time period for Food Calories selected from the drop down options for the selected patient.
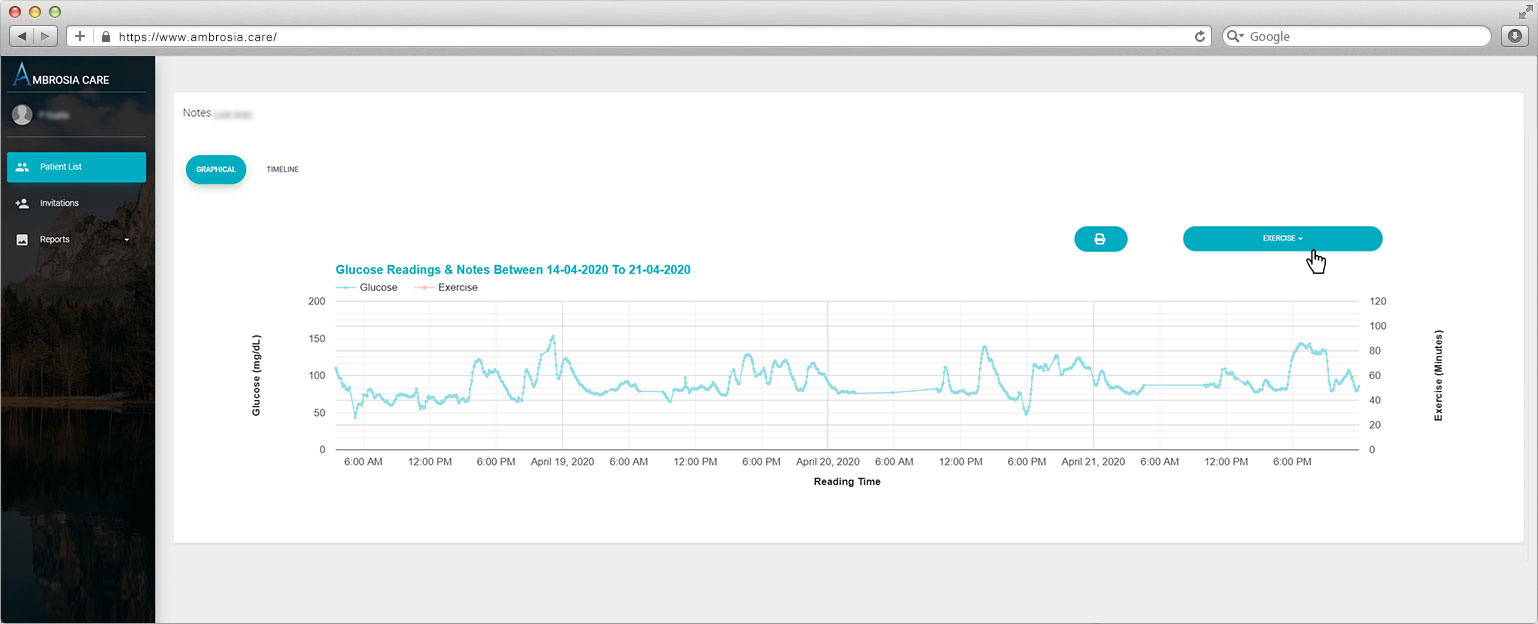
8 Glucose Reading vs. Exercise Graph
Glucose graph over a selected time period for Exercise selected from the drop down options for the selected patient.
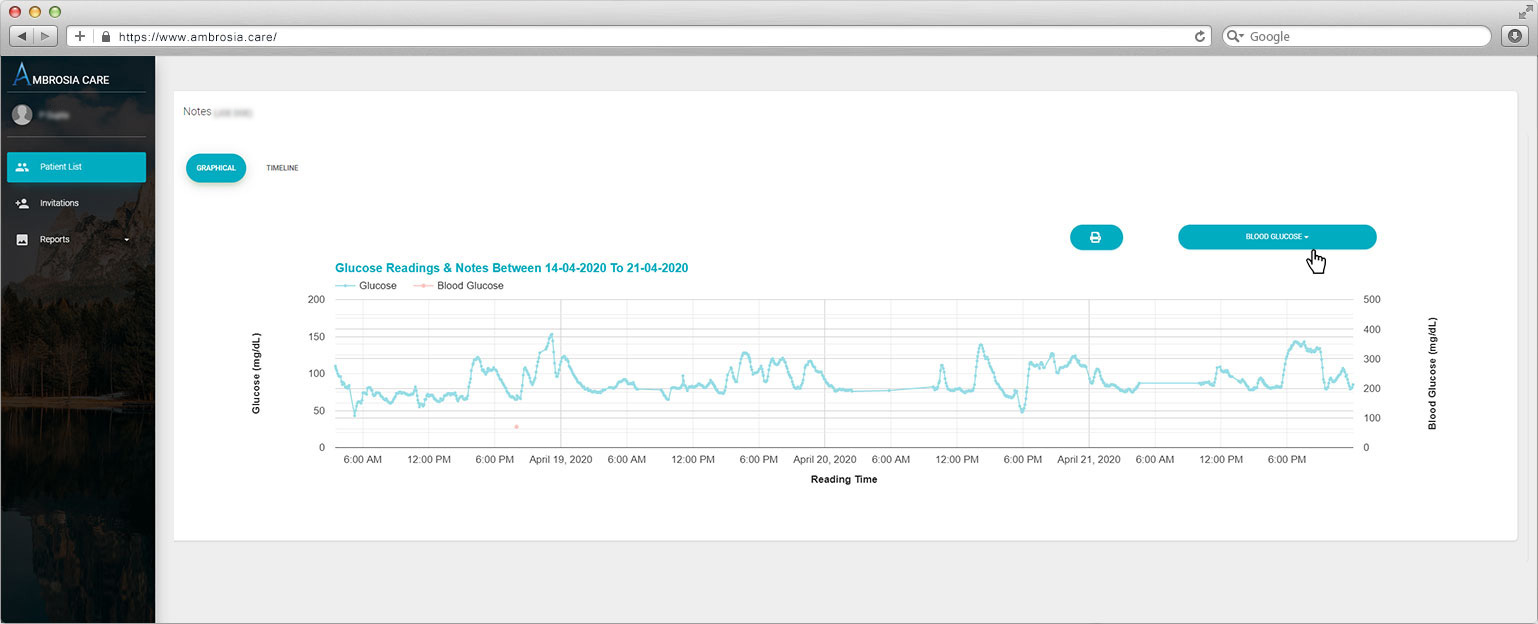
9 Glucose Reading vs. Blood Glucose Graph
Glucose graph over a selected time period for Exercise selected from the drop down options for the selected patient.
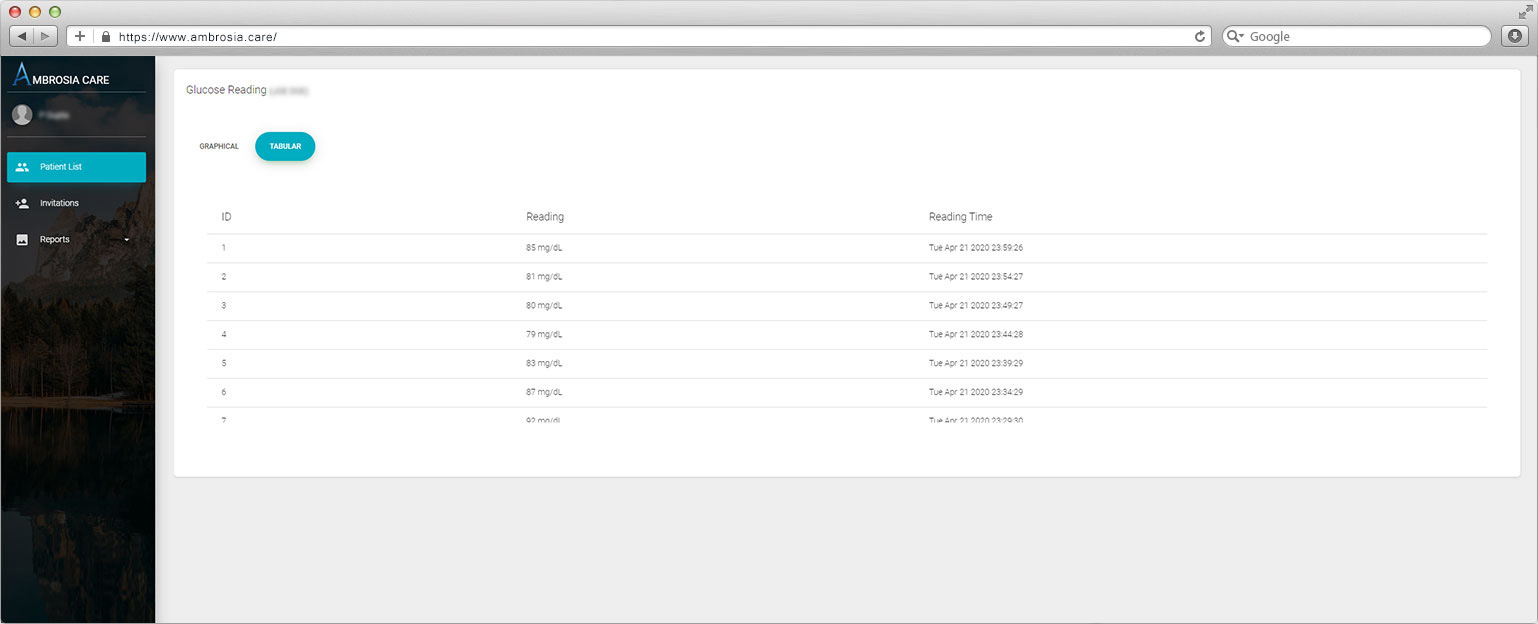
10 Glucose Reading Table
Glucose reading in tabular form over a selected time period for the selected patient.
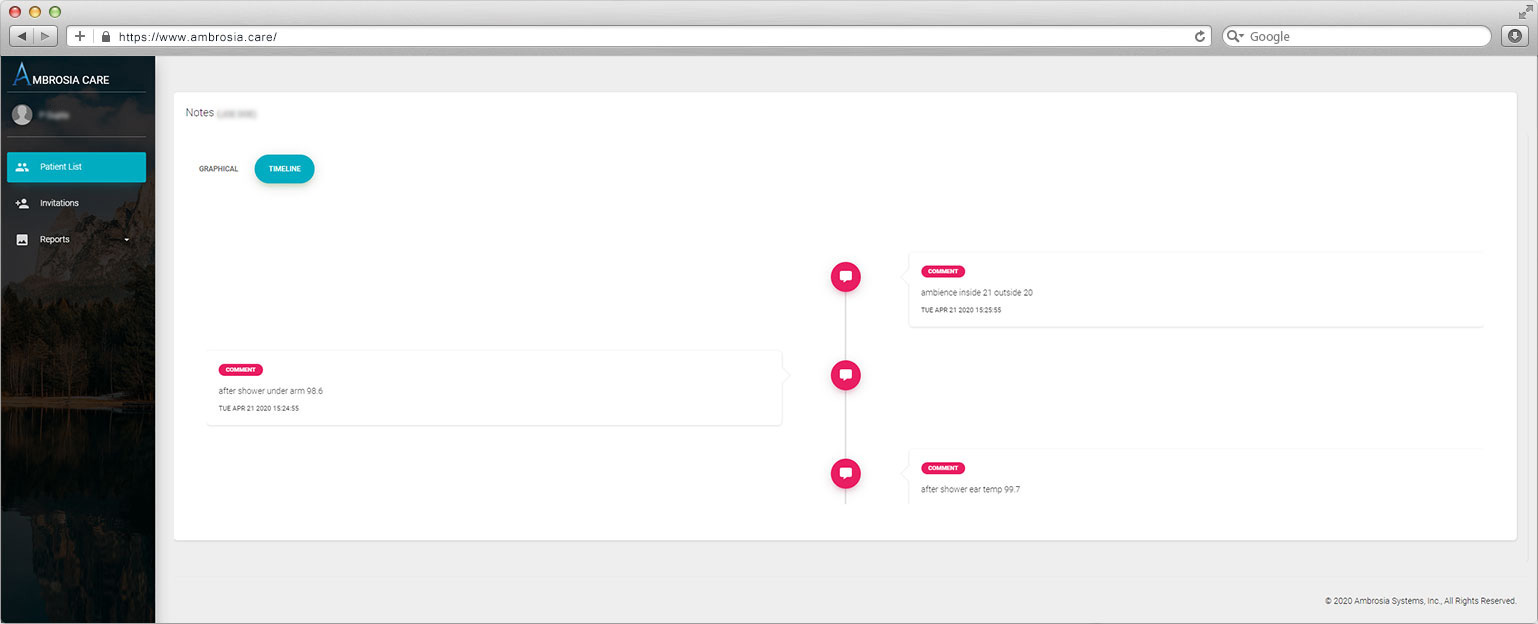
11 Notes Timeline
Notes entries represented as a timeline for the selected patient.
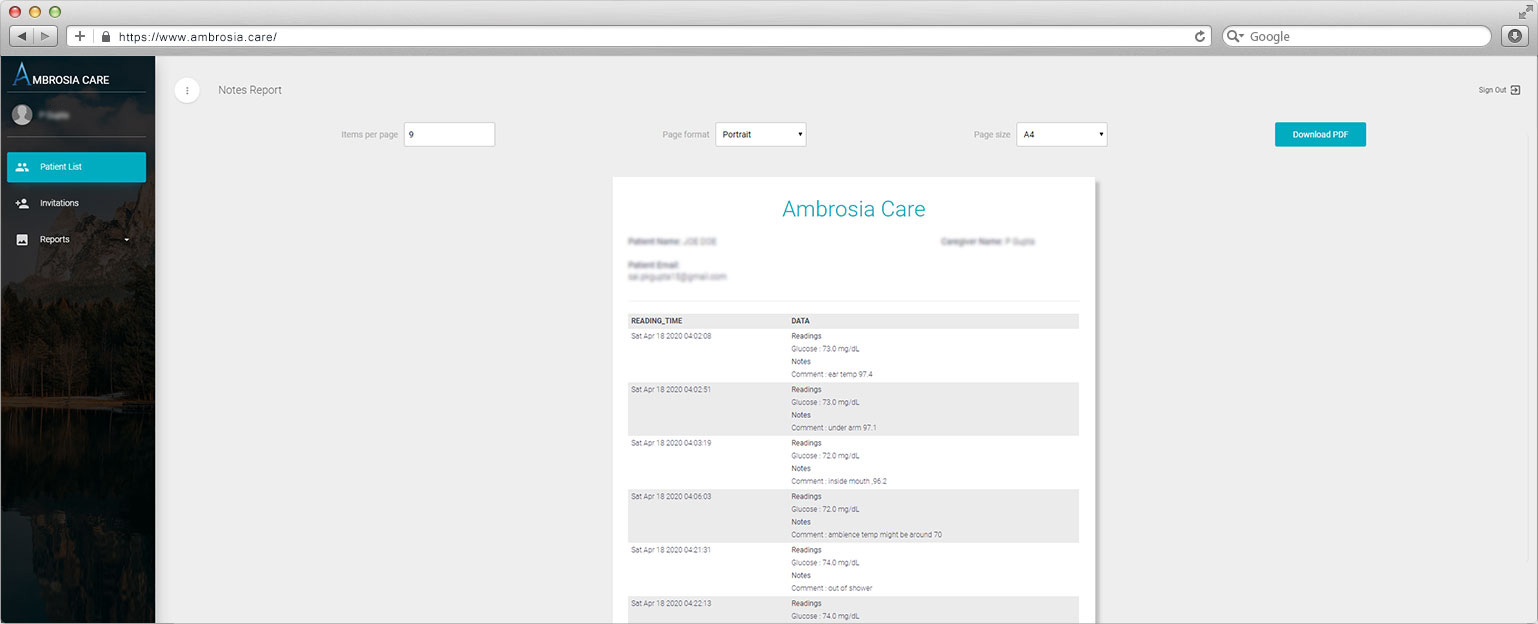
12 Notes Report
Glucose and notes shown in one place sorted by time for the selected patient.
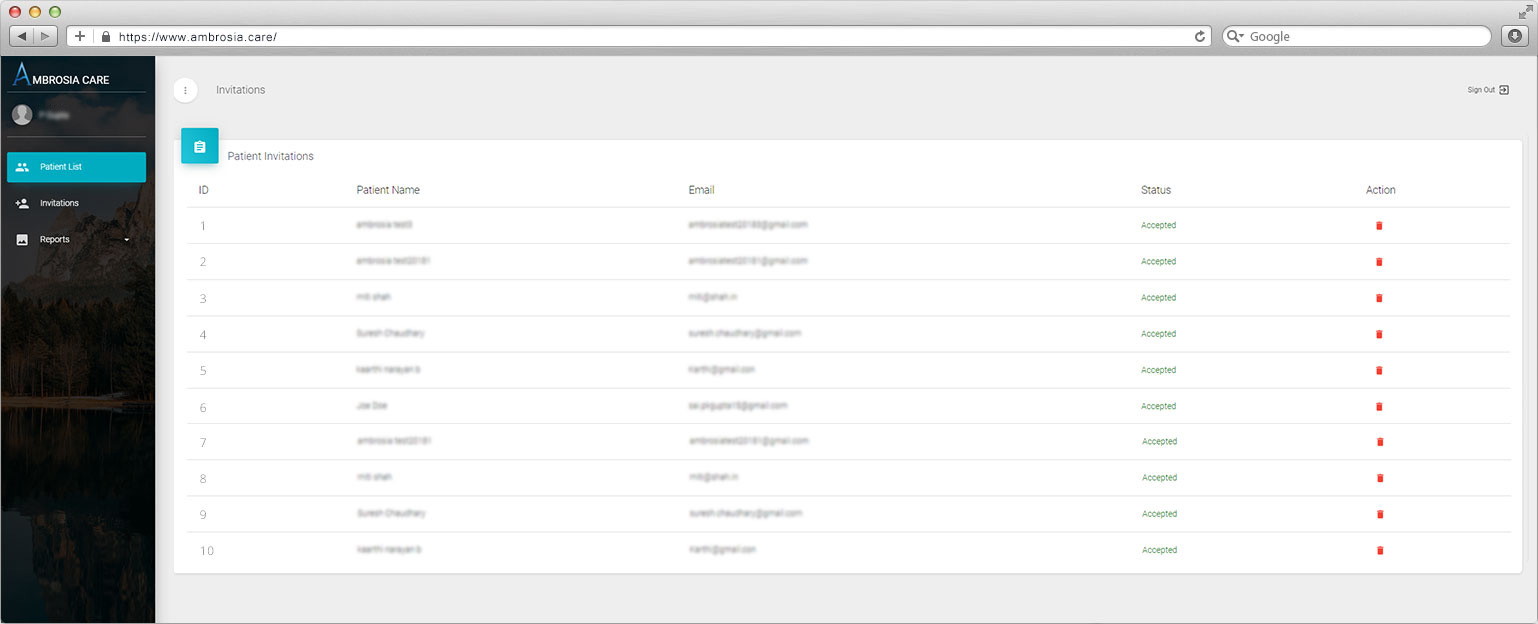
13 Invitations
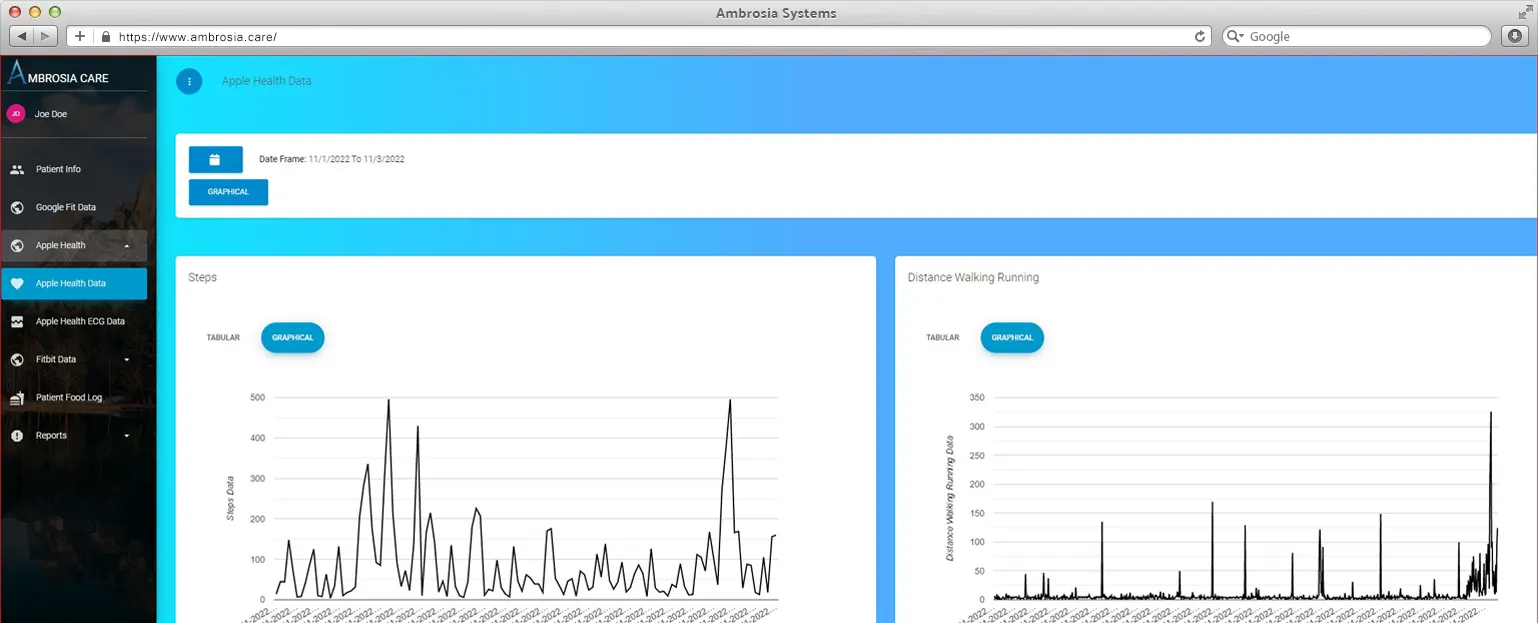
14 Apple Health Activities
Apple Health Activities
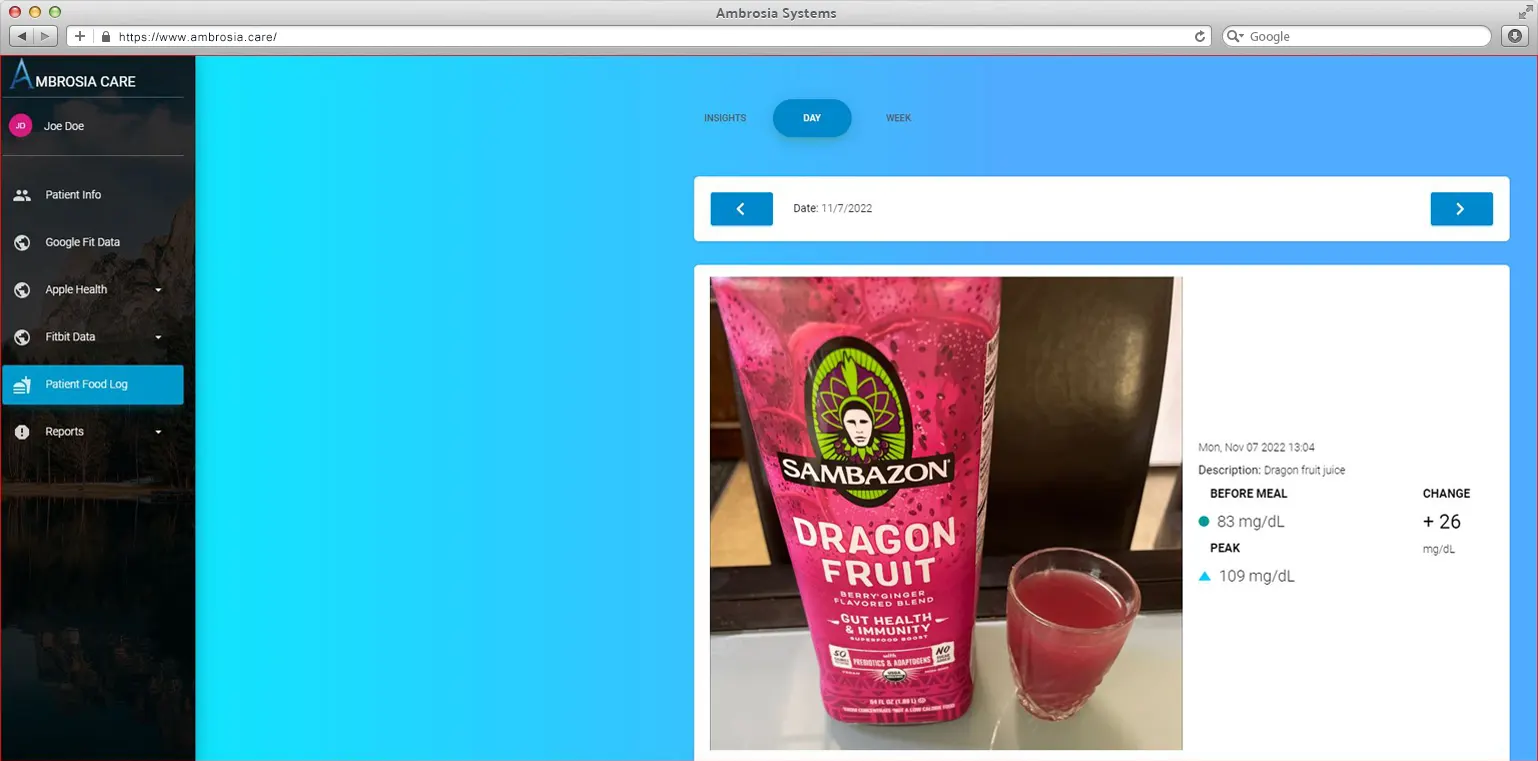
15 Food Insights
Food Insights